
How to Get Reporting Overview in WordPress?
Table of Content
Download Paymattic – it’s Free!

Subscribe To Get
WordPress Guides, Tips, and Tutorials
We will never spam you. We will only send you product updates and tips.
Reporting overview gives you insight into your business, project, or campaign performance. It provides you with data about your organization’s performance. For example, if you start a campaign, it will provide you with a quick idea of your campaign progress. It relieves you from finding out how different sections of your campaign are performing.
So, let’s get some notion about reporting overview.
What is reporting overview?
A reporting overview gives you a summary in detail about a campaign. It organizes data into informal summaries to monitor performance. It can identify which portion needs to be upgraded to improve business performance. Reporting overview has a similar layout to a summary report.
The report section will provide a quick rundown of your ongoing campaigns, raised funds, payment methods, etc.
Why is reporting overview essential?
Reporting overviews are used for long-term performance analysis. Reporting overviews are essential for the following reasons:
- To know any organization, project, and business condition and how much improvement is required.
- To give the reader a whole outlook of the entire report.
- To provide concrete data on conducting business.
- To help the organizer in making decisions.
- To identify and solve a problem.
- To get a quick message on which part needs to be upgraded.
Once there is enough data, it’s often easy to make a reporting overview from the information shown at the dashboard.
Check out the best fundraising plugins for your WordPress site
Choose a plugin to get reporting overview
Many plugins are available in WordPress, which also provides reporting overview, but you can use Paymattic for its easy-to-digest features.
Paymattic is a WordPress payment and donation plugin; this multi-purpose plugin is fit for your online business, online fundraising, and membership programs.
With Paymattic, you can quickly see your payment forms or donation forms’ individual performance from the report section. These detailed reports and analytics features give a bird’s eye view of your form. It describes each part of the form, and you will get an idea of which parts need to be upgraded.
This feature also gives you quick insights into your campaign through detailed reports and analytics and allows you to make an informed decision.
Get reporting overview in WordPress with Paymattic
To get reporting overview from the WordPress payment and donation plugin Paymattic, first, go to the Paymattic dashboard. Then select the Reports tab.
Here you will find the following options. We will break down each part separately for your clear understanding.
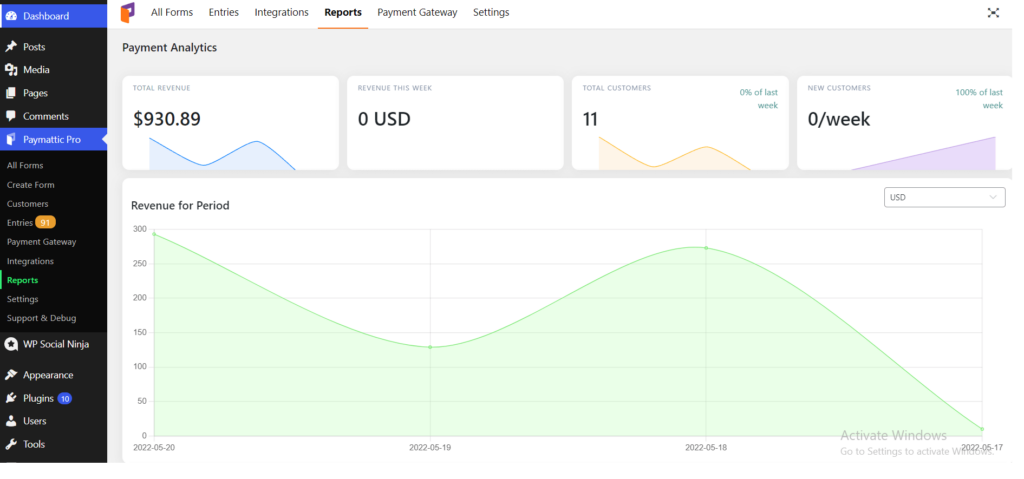
Total Revenue– The total revenue tab shows the complete revenue earned from transactions through this plugin. The total revenue tab will break the amount into different currencies if the customers pay in a variety of them. And if you click on the Expand all button, it will display all amounts.
Revenue this Week– Revenue this week represents the total amount earned in the current week. It will indicate the flow of revenue with the help of clean graphs. This tab also categorizes revenue by different currencies.
Total Customers– The total customers in this tab indicate the number of people who made transactions through this plugin.
New Customers– The new customer tab shows the number of people who have made transactions for the first time in the current week. This particular tab compares the number of customers acquired in a week to the past week.
Revenue for Period– This tab also presents its data with a graph. The line graph displays all revenue earned within a specific period. If you change the currency in the box set at the right sidebar, this graph will show you the result for that specific currency.
Revenue breakdown- In the revenue breakdown tab, all the information about revenue is displayed, such as:

- Date
- The status of revenue (paid/ unpaid)
- Amount of submission
- Amount of net revenue
- Currency
You can also know the number of submissions made within a specific date. You can also see the complete revenue breakdown even if multiple currencies are involved.
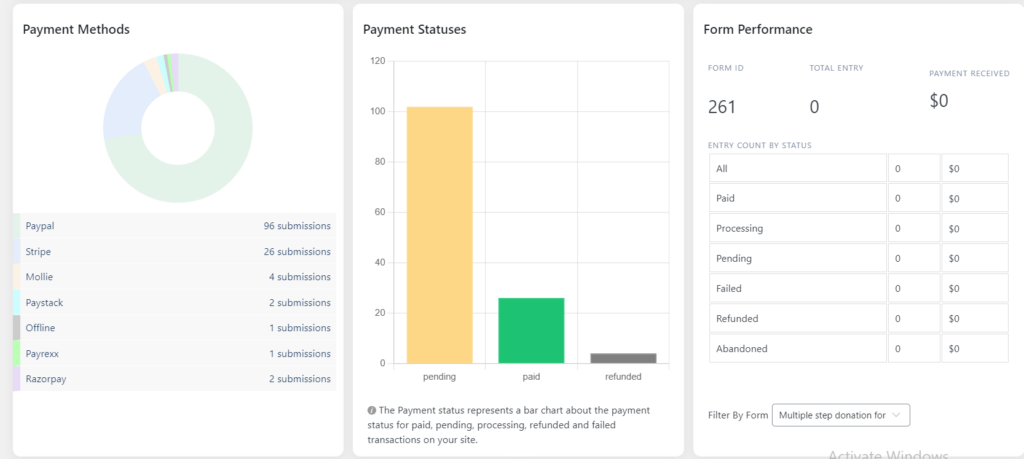
Payment Methods– The doughnut chart represents the payment methods tab. Each type of payment method is marked differently in this graph. You can see the list of payment methods with the number of submissions below this graph.
Payment Statuses– Payment statuses are indicated in the chart based on submission rate, whether they were paid, pending, or refunded.
Form Performance– It shows form performance, such as how many entries were made, the total payment received through a particular form, and all transactions including paid, pending, failed, processed, refunded, or abandoned.

Top Customers– Top customer tab shows the top customer of this plugin based on the highest amount of payments received. In the top corner of this tab, you can filter currency. The changing of currency will change top customers.
Recent Activity– This tab shows all the recent activities (transactions) made through your website. All the Paid, Pending, Processing, Failed, and Refunded submissions are marked in a different color. You can see all the details about your form submission by clicking on the form listed in this tab.
Final word
This blog should give you a clear idea about the reporting overview dashboard in Paymattic. This neat display of concrete data gives you a quick overview of all the transactions made through your form.
Moreover, here you will get an aerial view of your payment form. So if you are thinking of creating a payment or donation form, don’t forget to try Paymattic Pro.
Thanks for your patience in reading our blog about getting a reporting overview in WordPress. If you have any queries, don’t forget to contact us, or you can comment below.
Join the thousands already enjoying Paymattic Pro!







Leave a Reply